Memory usage visibility improvements
The existing Available Memory column has been replaced with a new Memory Usage (GB) column in Device Management, providing a clearer view of device memory consumption. The updated display shows used versus total memory in gigabytes, alongside a visual progress bar and percentage indicator, making it easier to identify devices approaching resource limits.
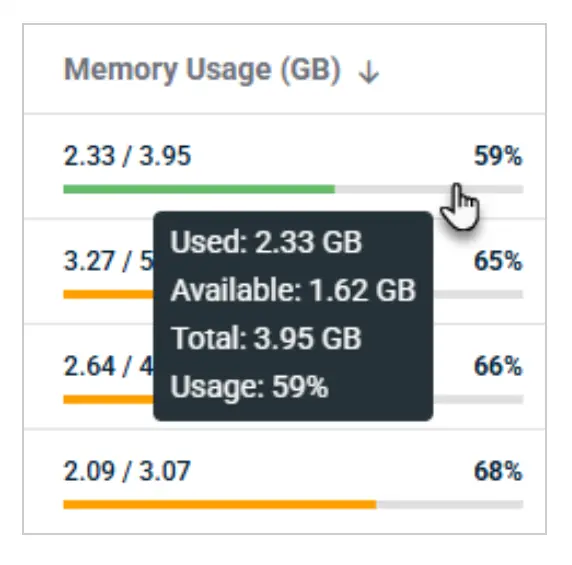
The new column supports sorting by memory utilization percentage and uses color-coded thresholds to highlight potential issues at a glance. Additional details, including used, available, total memory and utilization percentage, are available through a hover tooltip for deeper insight.
Click here to see everything new in Kaseya VSA 10.27 updates.
One Complete Platform for IT & Security Management
Kaseya 365 is the all-in-one solution for managing, securing, and automating IT. With seamless integrations across critical IT functions, it simplifies operations, strengthens security, and boosts efficiency.

Best endpoint management software in 2026: Top 5 solutions ranked
Explore the five best endpoint management tools in 2026, compared across OS and device coverage, patching capabilities, discovery, inventory and security.
Read now
Best RMM software in 2026: Top 5 tools ranked
Compare the 5 best RMM software tools in 2026. See AI, automation, integrations and onboarding side by side, plus who each platform fits best.
Read now
Datto SaaS Protection Update: Graph API Migration & Performance
Get a direct update on Datto SaaS Protection: Microsoft Graph API migration progress, up to 2x faster backups, reliability gains, and what’s still to come.
Read now